THE DISTRIBUTION OF FINANCES
Federal, state, and local governments depend on different sources of revenue to finance their annual expenditures. In 2014, total revenue (or receipts) reached $3.2 trillion for the federal government, $1.7 trillion for the states, and $1.2 trillion for local governments.Data reported by http://www.usgovernmentrevenue.com/federal_revenue. State and local government figures are estimated. Two important developments have fundamentally changed the allocation of revenue since the early 1900s. First, the ratification of the Sixteenth Amendment in 1913 authorized Congress to impose income taxes without apportioning it among the states on the basis of population, a burdensome provision that Article I, Section 9, had imposed on the national government.Pollock v. Farmers’ Loan & Trust Co., 158 U.S. 601 (1895). With this change, the federal government’s ability to raise revenue significantly increased and so did its ability to spend.
The second development regulates federal grants, that is, transfers of federal money to state and local governments. These transfers, which do not have to be repaid, are designed to support the activities of the recipient governments, but also to encourage them to pursue federal policy objectives they might not otherwise adopt. The expansion of the federal government’s spending power has enabled it to transfer more grant money to lower government levels, which has accounted for an increasing share of their total revenue.See Robert Jay Dilger, “Federal Grants to State and Local Governments: A Historical Perspective on Contemporary Issues,” Congressional Research Service, Report 7-5700, 5 March 2015.
The sources of revenue for federal, state, and local governments are detailed in Figure. Although the data reflect 2013 results, the patterns we see in the figure give us a good idea of how governments have funded their activities in recent years. For the federal government, 47 percent of 2013 revenue came from individual income taxes and 34 percent from payroll taxes, which combine Social Security tax and Medicare tax.
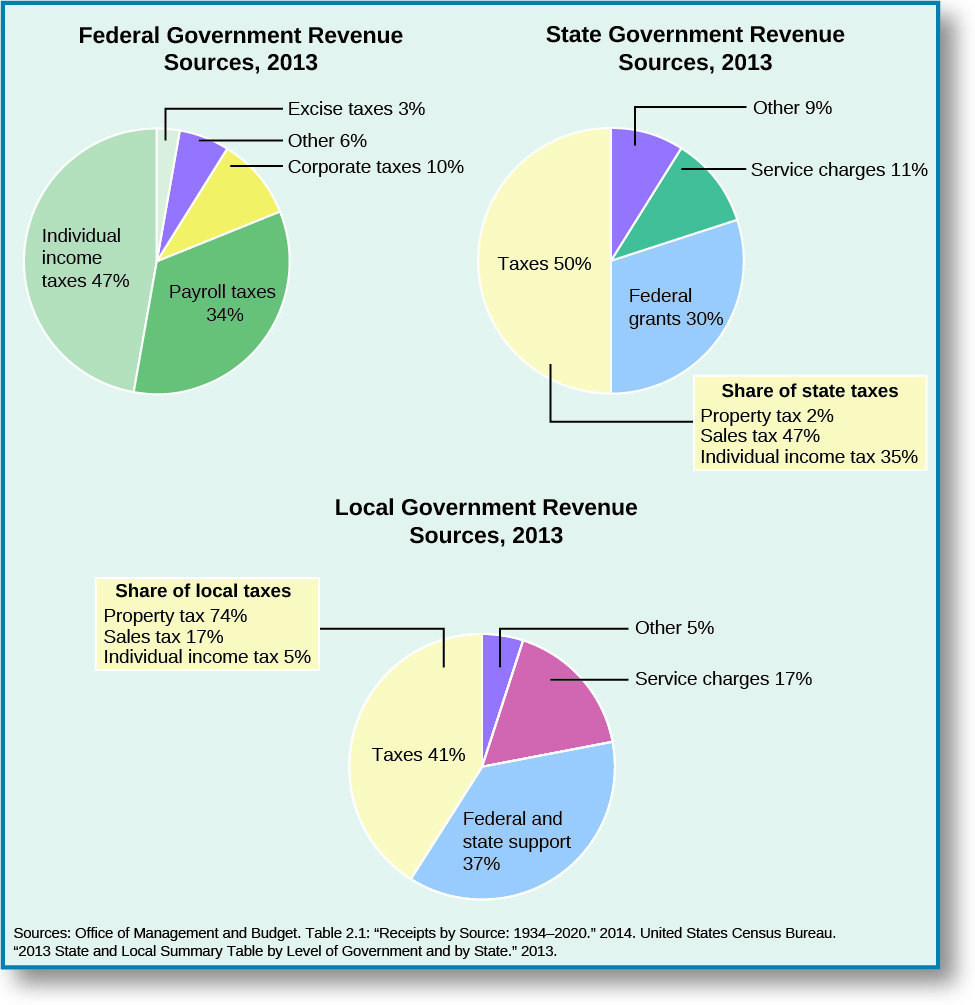
For state governments, 50 percent of revenue came from taxes, while 30 percent consisted of federal grants. Sales tax—which includes taxes on purchased food, clothing, alcohol, amusements, insurance, motor fuels, tobacco products, and public utilities, for example—accounted for about 47 percent of total tax revenue, and individual income taxes represented roughly 35 percent. Revenue from service charges (e.g., tuition revenue from public universities and fees for hospital-related services) accounted for 11 percent.
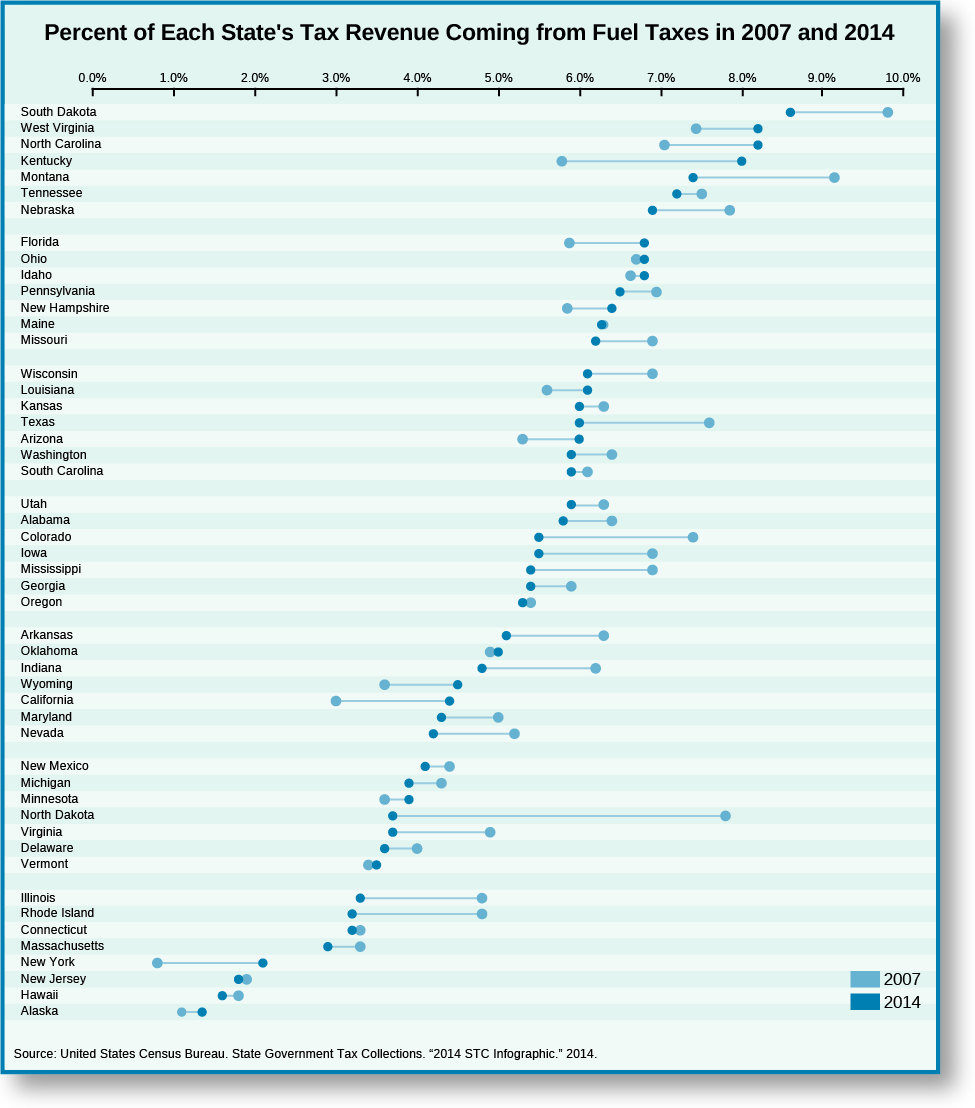
The tax structure of states varies. Alaska, Florida, Nevada, South Dakota, Texas, Washington, and Wyoming do not have individual income taxes. Figure illustrates yet another difference: Fuel tax as a percentage of total tax revenue is much higher in South Dakota and West Virginia than in Alaska and Hawaii. However, most states have done little to prevent the erosion of the fuel tax’s share of their total tax revenue between 2007 and 2014 (notice that for many states the dark blue dots for 2014 are to the left of the light blue numbers for 2007). Fuel tax revenue is typically used to finance state highway transportation projects, although some states do use it to fund non-transportation projects.
The most important sources of revenue for local governments in 2013 were taxes, federal and state grants, and service charges. For local governments the property tax, a levy on residential and commercial real estate, was the most important source of tax revenue, accounting for about 74 percent of the total. Federal and state grants accounted for 37 percent of local government revenue. State grants made up 87 percent of total local grants. Charges for hospital-related services, sewage and solid-waste management, public city university tuition, and airport services are important sources of general revenue for local governments.
Intergovernmental grants are important sources of revenue for both state and local governments. When economic times are good, such grants help states, cities, municipalities, and townships carry out their regular functions. However, during hard economic times, such as the Great Recession of 2007–2009, intergovernmental transfers provide much-needed fiscal relief as the revenue streams of state and local governments dry up. During the Great Recession, tax receipts dropped as business activities slowed, consumer spending dropped, and family incomes decreased due to layoffs or work-hour reductions. To offset the adverse effects of the recession on the states and local governments, federal grants increased by roughly 33 percent during this period.Jeffrey L. Barnett et al. 2014. 2012 Census of Governments: Finance-State and Local Government Summary Report, Appendix Table A-1. December 17. Washington, DC: United States Census Bureau, 2.
In 2009, President Obama signed the American Recovery and Reinvestment Act (ARRA), which provided immediate economic-crisis management assistance such as helping local and state economies ride out the Great Recession and shoring up the country’s banking sector. A total of $274.7 billion in grants, contracts, and loans was allocated to state and local governments under the ARRA.Dilger, “Federal Grants to State and Local Governments,” 4. The bulk of the stimulus funds apportioned to state and local governments was used to create and protect existing jobs through public works projects and to fund various public welfare programs such as unemployment insurance.James Feyrer and Bruce Sacerdote. 2011. “Did the Stimulus Stimulate? Real Time Estimates of the Effects of the American Recovery and Reinvestment Act” (Working Paper No. 16759), Cambridge, MA: National Bureau of Economic Research. http://www.nber.org/papers/w16759.pdf
How are the revenues generated by our tax dollars, fees we pay to use public services and obtain licenses, and monies from other sources put to use by the different levels of government? A good starting point to gain insight on this question as it relates to the federal government is Article I, Section 8, of the Constitution. Recall, for instance, that the Constitution assigns the federal government various powers that allow it to affect the nation as a whole. A look at the federal budget in 2014 (Figure) shows that the three largest spending categories were Social Security (24 percent of the total budget); Medicare, Medicaid, the Children’s Health Insurance Program, and marketplace subsidies under the Affordable Care Act (24 percent); and defense and international security assistance (18 percent). The rest was divided among categories such as safety net programs (11 percent), including the Earned Income Tax Credit and Child Tax Credit, unemployment insurance, food stamps, and other low-income assistance programs; interest on federal debt (7 percent); benefits for federal retirees and veterans (8 percent); and transportation infrastructure (3 percent).Data reported by the Center on Budget and Policy Priorities. 2015. “Policy Basics: Where Do Our Federal Tax Dollars Go?” March 11. http://www.cbpp.org/research/policy-basics-where-do-our-federal-tax-dollars-go It is clear from the 2014 federal budget that providing for the general welfare and national defense consumes much of the government’s resources—not just its revenue, but also its administrative capacity and labor power.
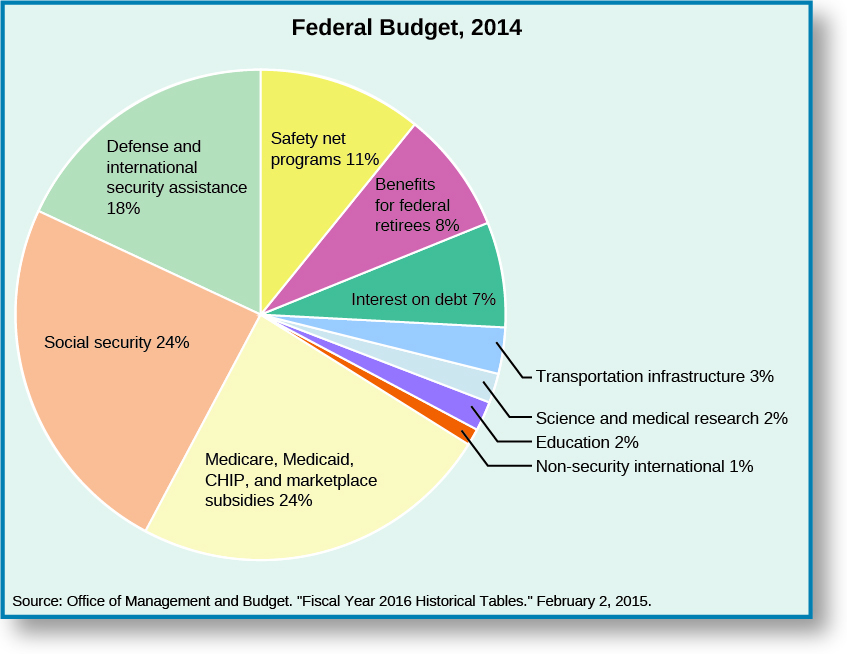
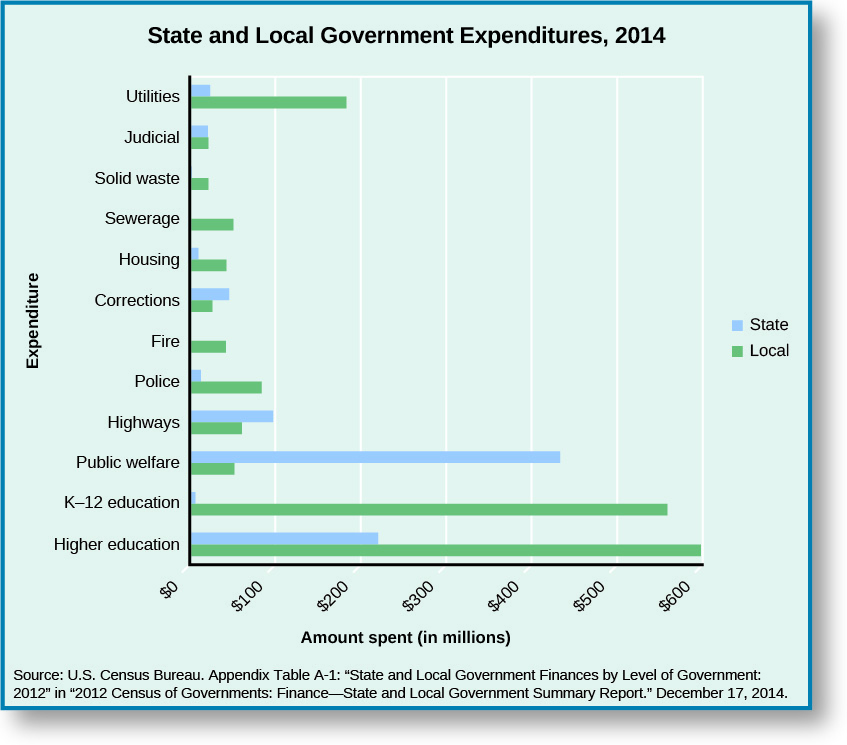
Figure compares recent spending activities of local and state governments. Educational expenditures constitute a major category for both. However, whereas the states spend comparatively more than local governments on university education, local governments spend even more on elementary and secondary education. That said, nationwide, state funding for public higher education has declined as a percentage of university revenues; this is primarily because states have taken in lower amounts of sales taxes as internet commerce has increased. Local governments allocate more funds to police protection, fire protection, housing and community development, and public utilities such as water, sewage, and electricity. And while state governments allocate comparatively more funds to public welfare programs, such as health care, income support, and highways, both local and state governments spend roughly similar amounts on judicial and legal services and correctional services.