PUBLIC OPINION AND POLITICAL INSTITUTIONS
Public opinion about American institutions is measured in public approval ratings rather than in questions of choice between positions or candidates. The congressional and executive branches of government are the subject of much scrutiny and discussed daily in the media. Polling companies take daily approval polls of these two branches. The Supreme Court makes the news less frequently, and approval polls are more likely after the court has released major opinions. All three branches, however, are susceptible to swings in public approval in response to their actions and to national events. Approval ratings are generally not stable for any of the three. We next look at each in turn.
The president is the most visible member of the U.S. government and a lightning rod for disagreement. Presidents are often blamed for the decisions of their administrations and political parties, and are held accountable for economic and foreign policy downturns. For these reasons, they can expect their approval ratings to slowly decline over time, increasing or decreasing slightly with specific events. On average, presidents enjoy a 66 percent approval rating when starting office, but it drops to 53 percent by the end of the first term. Presidents serving a second term average a beginning approval rating of 55.5 percent, which falls to 47 percent by the end of office. President Obama’s presidency has followed the same trend. He entered office with a public approval rating of 67 percent, which fell to 54 percent by the third quarter, dropped to 52 percent after his reelection, and, as of August 2015, was at 46 percent (Figure).
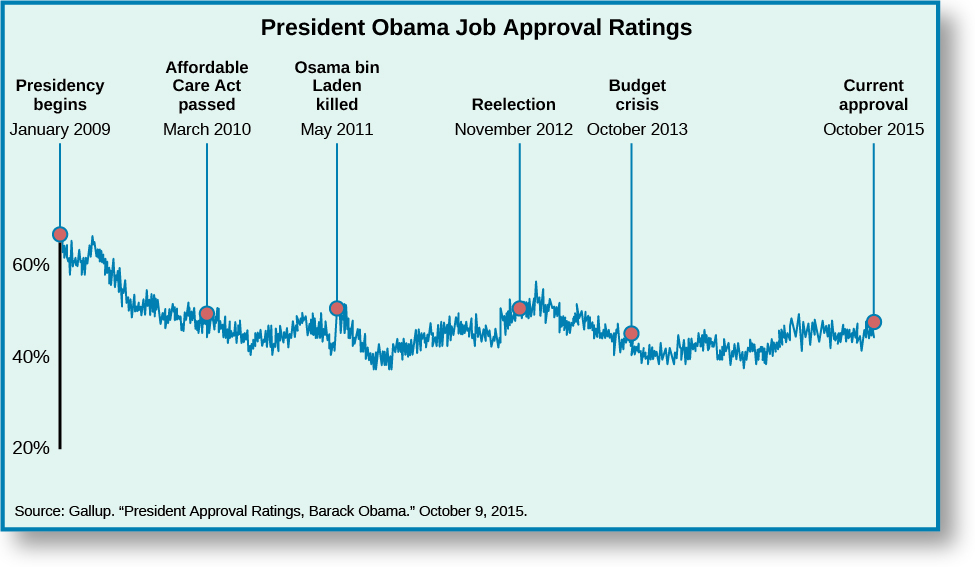
Events during a president’s term may spike his or her public approval ratings. George W. Bush’s public approval rating jumped from 51 percent on September 10, 2001, to 86 percent by September 15 following the 9/11 attacks. His father, George H. W. Bush, had received a similar spike in approval ratings (from 58 to 89 percent) following the end of the first Persian Gulf War in 1991.Gallup. 2015. “Presidential Approval Ratings – George W. Bush.” Gallup. June 20, 2015. http://www.gallup.com/poll/116500/Presidential-Approval-Ratings-George-Bush.aspx (February 18, 2016). These spikes rarely last more than a few weeks, so presidents try to quickly use the political capital they bring. For example, the 9/11 rally effect helped speed a congressional joint resolution authorizing the president to use troops, and the “global war on terror” became a reality.115 STAT. 2001. “224. Public Law 107-40. Joint Resolution.” 107th Congress. http://www.gpo.gov/fdsys/pkg/PLAW-107publ40/pdf/PLAW-107publ40.pdf (February 18, 2016). The rally was short-lived, and support for the wars in Iraq and Afghanistan quickly deteriorated post-2003.Pew Research Center. 2008. “Public Attitudes Towards the War in Iraq: 2003-2008.” Pew Research Center. March 19, 2008. http://www.pewresearch.org/2008/03/19/public-attitudes-toward-the-war-in-iraq-20032008/ (February 18, 2016); Pew Research Center. 2014. “More Now See Failure than Success in Iraq, Afghanistan.” Pew Research Center. January 30, 2014. http://www.people-press.org/2014/01/30/more-now-see-failure-than-success-in-iraq-afghanistan/ (February 18, 2016).
Some presidents have had higher or lower public approval than others, though ratings are difficult to compare, because national and world events that affect presidential ratings are outside a president’s control. Several chief executives presided over failing economies or wars, whereas others had the benefit of strong economies and peace. Gallup, however, gives an average approval rating for each president across the entire period served in office. George W. Bush’s average approval rating from 2001 to 2008 was 49.4 percent. Ronald Reagan’s from 1981 to 1988 was 52.8 percent, despite his winning all but thirteen electoral votes in his reelection bid. Bill Clinton’s average approval from 1993 to 2000 was 55.1 percent, including the months surrounding the Monica Lewinsky scandal and his subsequent impeachment. To compare other notable presidents, John F. Kennedy averaged 70.1 percent and Richard Nixon 49 percent.Gallup. 2015. “Presidential Job Approval Center.” Gallup. June 20, 2015. http://www.gallup.com/poll/124922/Presidential-Job-Approval-Center.aspx?utm_source=PRESIDENTIAL_JOB_APPROVAL&utm_medium=topic&utm_campaign=tiles (February 18, 2016). Kennedy’s average was unusually high because his time in office was short; he was assassinated before he could run for reelection, leaving less time for his ratings to decline. Nixon’s unusually low approval ratings reflect several months of media and congressional investigations into his involvement in the Watergate affair, as well as his resignation in the face of likely impeachment.

Gallup polling has tracked approval ratings for all presidents since Harry Truman. The Presidential Job Approval Center allows you to compare weekly approval ratings for all tracked presidents, as well as their average approval ratings.
Public Mood and Watershed Moments
Polling is one area of U.S. politics in which political practitioners and political science scholars interact. Each election cycle, political scientists help media outlets interpret polling, statistical data, and election forecasts. One particular watershed moment in this regard occurred when Professor James Stimson, of the University of North Carolina at Chapel Hill, developed his aggregated measure of public mood. This measure takes a variety of issue positions and combines them to form a general ideology about the government. According to Professor Stimson, the American electorate became more conservative in the 1970s and again in the 1990s, as demonstrated by Republican gains in Congress. With this public mood measure in mind, political scientists can explain why and when Americans allowed major policy shifts. For example, the Great Society’s expansion of welfare and social benefits occurred during the height of liberalism in the mid-1960s, while the welfare cuts and reforms of the 1990s occurred during the nation’s move toward conservatism. Tracking conservative and liberal shifts in the public’s ideology allows policy analysts to predict whether voters are likely to accept or reject major policies.
What other means of measuring the public mood do you think might be effective and reliable? How would you implement them? Do you agree that watershed moments in history signal public mood changes? If so, give some examples. If not, why not?
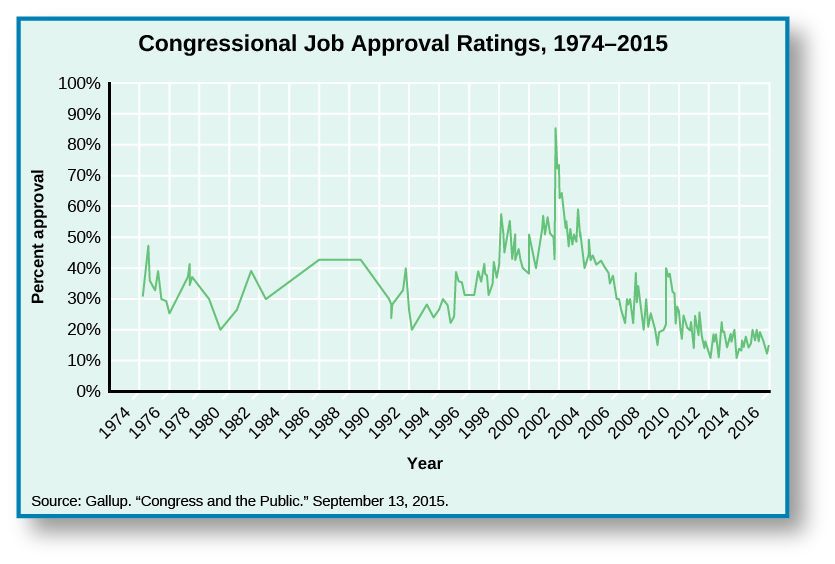
Congress as an institution has historically received lower approval ratings than presidents, a striking result because individual senators and representatives are generally viewed favorably by their constituents. While congressional representatives almost always win reelection and are liked by their constituents back home, the institution itself is often vilified as representing everything that is wrong with politics and partisanship.
As of August 2015, public approval of Congress sat at around 20 percent.Gallup. 2015. “Congress and the Public.” Gallup. June 21, 2015. http://www.gallup.com/poll/1600/Congress-Public.aspx (February 18, 2016). For most of the last forty years, congressional approval levels have bounced between 20 percent and 60 percent, but in the last fifteen years they have regularly fallen below 40 percent. Like President George W. Bush, Congress experienced a short-term jump in approval ratings immediately following 9/11, likely because of the rallying effect of the terrorist attacks. Congressional approval had dropped back below 50 percent by early 2003 (Figure).
While presidents are affected by foreign and domestic events, congressional approval is mainly affected by domestic events. When the economy rebounds or gas prices drop, public approval of Congress tends to go up. But when party politics within Congress becomes a domestic event, public approval falls. The passage of revenue bills has become an example of such an event, because deficits require Congress to make policy decisions before changing the budget. Deficit and debt are not new to the United States. Congress and presidents have attempted various methods of controlling debt, sometimes successfully and sometimes not. In the past three decades alone, however, several prominent examples have shown how party politics make it difficult for Congress to agree on a budget without a fight, and how these fights affect public approval.
In 1995, Democratic president Bill Clinton and the Republican Congress hit a notable stalemate on the national budget. In this case, the Republicans had recently gained control of the House of Representatives and disagreed with Democrats and the president on how to cut spending and reduce the deficit. The government shut down twice, sending non-essential employees home for a few days in November, and then again in December and January.Neil Irwin, “The 1995 Shutdown, from a Budget Official’s Perspective,” Washington Post, 27 September 2013. Congressional approval fell during the event, from 35 to 30 percent.Gallup. 2015. “Congress and the Public.” Gallup. June 21, 2015. http://www.gallup.com/poll/1600/Congress-Public.aspx (February 18, 2016); Jeffrey Jones. 2007. “Congress Approval Rating Matches Historical Low.” Gallup. August 21, 2007. http://www.gallup.com/poll/28456/congress-approval-rating-matches-historical-low.aspx (February 18, 2016).
Divisions between the political parties, inside the Republican Party, and between Congress and the president became more pronounced over the next fifteen years, with the media closely covering the political strife.Dan Merica. 2013. “1995 and 2013: Three Differences Between the Two Shutdowns.” CNN. October 4, 2013. http://www.cnn.com/2013/10/01/politics/different-government-shutdowns/ (February 18, 2016). In 2011, the United States reached its debt ceiling, or maximum allowed debt amount. After much debate, the Budget Control Act was passed by Congress and signed by President Obama. The act increased the debt ceiling, but it also reduced spending and created automatic cuts, called sequestrations, if further legislation did not deal with the debt by 2013. When the country reached its new debt ceiling of $16.4 trillion in 2013, short-term solutions led to Congress negotiating both the debt ceiling and the national budget at the same time. The timing raised the stakes of the budget, and Democrats and Republicans fought bitterly over the debt ceiling, budget cuts, and taxes. Inaction triggered the automatic cuts to the budget in areas like defense, the courts, and public aid. By October, approximately 800,000 federal employees had been sent home, and the government went into partial shut-down for sixteen days before Congress passed a bill to raise the debt ceiling.Paul Lewis, “US Shutdown Drags Into Second Day as Republicans Eye Fresh Debt Ceiling Crisis,” Guardian, 2 October 2013. The handling of these events angered Americans, who felt the political parties needed to work together to solve problems rather than play political games. During the 2011 ceiling debate, congressional approval fell from 18 to 13 percent, while in 2013, congressional approval fell to a new low of 9 percent in November.Gallup. 2015. “Congress and the Public.” Gallup. June 21, 2015. http://www.gallup.com/poll/1600/Congress-Public.aspx (February 18, 2016).
The Supreme Court generally enjoys less visibility than the other two branches of government, which leads to more stable but also less frequent polling results. Indeed, 22 percent of citizens surveyed in 2014 had never heard of Chief Justice John Roberts, the head of the Supreme Court.Andrew Dugan. 2014. “Americans’ Approval of Supreme Court New All-Time Low.” Gallup. July 19, 2014. http://www.gallup.com/poll/163586/americans-approval-supreme-court-near-time-low.aspx (February 18, 2016). The court is protected by the justices’ non-elected, non-political positions, which gives them the appearance of integrity and helps the Supreme Court earn higher public approval ratings than presidents and Congress. To compare, between 2000 and 2010, the court’s approval rating bounced between 50 and 60 percent. During this same period, Congress had a 20 to 40 percent approval rating.
The Supreme Court’s approval rating is also less susceptible to the influence of events. Support of and opinions about the court are affected when the justices rule on highly visible cases that are of public interest or other events occur that cause citizens to become aware of the court.James L. Gibson, and Gregory A. Caldeira. 2009. “Knowing the Supreme Court? A Reconsideration of Public Ignorance of the High Court.” Journal of Politics 71 (2): 429–441. For example, following the Bush v. Gore case (2000), in which the court instructed Florida to stop recounting ballots and George W. Bush won the Electoral College, 80 percent of Republicans approved of the court, versus only 42 percent of Democrats.Bush v. Gore, 531 U.S. 98 (2000). Twelve years later, when the Supreme Court’s ruling in National Federation of Independent Business v. Sebelius (2012) let stand the Affordable Care Act’s requirement of individual coverage, approval by Democrats increased to 68 percent, while Republican support dropped to 29 percent.National Federation of Independent Business v. Sebelius, 567 U.S. ___ (2012); Andrew Dugan. 2014. “Americans’ Approval of Supreme Court New All-Time Low.” Gallup. July 19, 2014. http://www.gallup.com/poll/163586/americans-approval-supreme-court-near-time-low.aspx (February 18, 2016). Currently, following the handing down of decisions in King v. Burwell (2015) and Obergefell v. Hodges (2015), which allowed the Affordable Care Act’s subsidies and prohibited states from denying same-sex marriage, respectively, 45 percent of people said they approved of the way the Supreme Court handled its job, down 4 percent from before the decisions.King v. Burwell, 576 U.S. ___ (2015); Gallup Polling. 2015. “Supreme Court.” Gallup Polling. http://www.gallup.com/poll/4732/supreme-court.aspx (February 18, 2016).